

Digital Marketing Analytics
Have you ever looked at Google Analytics and seen a ton of traffic being reported visiting your website? Well, don’t believe these figures until you have stripped-out the vanity metrics first! In this article I’m going to show you what to look for and how the basic figures that Google reports can be very easily mis-interpreted.
Digital Marketing Analytics Need Relevance
It’s great to get that warm feeling when you open your Google Analytics report and see hundreds or thousands (maybe even tens of thousands) of visits being reported as visiting your site in the past month. But the simple fact is that if you or your marketing team have not taken care to create a customised view which is relevant to your business, then any marketing decision that you take which is based on the un-filtered data will be seriously skewed and at worst, irrelevant. Vanity metrics can be very misleading.
What Are Vanity Metrics?
Vanity metrics are any of the reported figures in a digital marketing analytics tool or utility that can be considered as:
> Not relevant to your business
> Providing little in the way of true marketing insights
> Not providing the marketing focused analytics that you need to take informed actions
Vanity metrics typically make the unwary feel very good about things when really, they need to be conducting a more in-depth investigation to uncover the true picture. They are actually quite easy to weed-out if you give it a little thought. And it’s worth taking the time to do this. No one wants to be making any business decision that is based on irrelevant data.
Using Google Analytics & Google Search Console
There are a whole host of really good analytics tools on the market that you can use to understand the effectiveness of your digital marketing activities – far too many to cover in a single blog! So, for this post I’m going to keep things simple and just focus on the two that everyone should be using – Google Analytics and Google Search Console. Both of these tools allow us to measure the effectiveness of our website performance (in fact, Google Analytics in particular can be used to measure a whole lot more, but again, that’s beyond the scope of a single blog!), so it’s a good place to start and to illustrate what we’re looking at.
To understand how even the most comprehensive analytics can provide you with data that is way off the mark, we’ll look at some examples. In the screenshot below we can see a typical view of the data you’ll see when you first log-in to the Google Analytics home page:
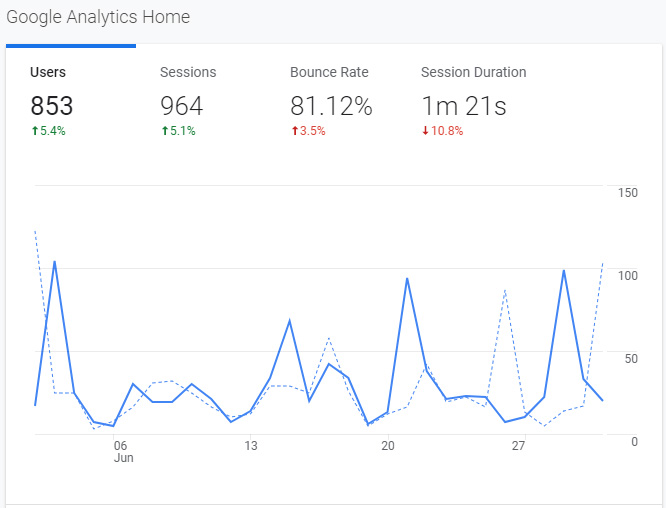
Happy days! You’re getting 853 Users over the past 30 days and although the Bounce Rate is a little higher than you’d like, the average Session Duration is a respectable 1 minute 21 seconds. But wait a minute. What data is this actually showing us? Turns out that this view is fundamentally the basic, original (unfiltered) view provided by Google Analytics. It contains (amongst other things) all of the visits from your own employees, all of the visits from your marketing specialists that you may be hiring, and all of the spam traffic that your site gets (yes, all sites get spam visits, and these are included in the data that you get from Google Analytics).
So, to get a more accurate picture of the actual situation, you’ll need to create a new filtered view and add that to your Google Analytics account. In that filtered view, you should add filters so that your own visits (and those from your various marketing contractors, who actually of course should do this for you if they are digital marketers!) are not reported, and also apply filters to get rid of all of the various spam visits that a site receives. With that done, the data for the same site as that illustrated above now looks like this:
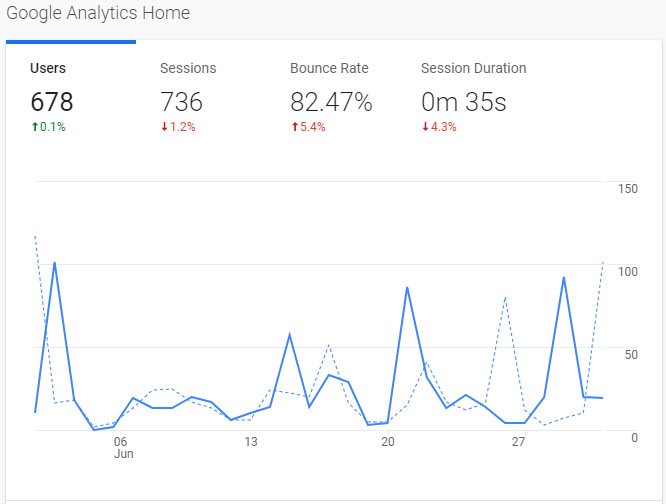
Ah, so now you see a different story. Same website, same timeframe, but more accurate metrics. What’s happened? Well, all of the misleading metrics have been removed. The site still has a reasonable 678 Users over the 30-day period, but the bounce rate is slightly up and the Session Duration is now down to a much less respectable 35 seconds only! Now that’s a concern. Generally, if people are interested in your content, they’ll stay on-site for 1 minute +. A much shorter duration like 35 seconds could indicate that your website content needs to be much more engaging. This is a key low-ranking signal to Google.
Let’s go a bit further. Of the 678 Users in the filtered view, how many are actually in the geography that you target? Let’s suppose that your market is UK only. Looking at the exact same data, but for UK only, we see this:
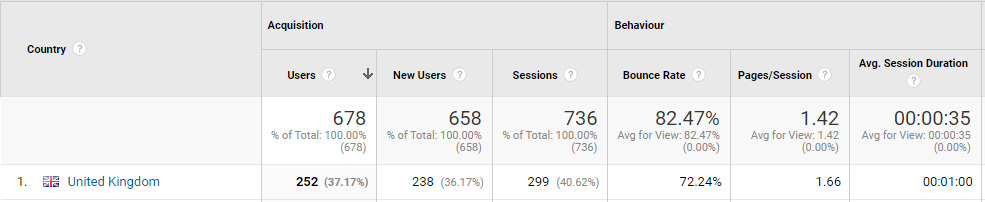
So now we’re down to 252 users for the same time period – not looking quite so good, is it? However, the UK bounce rate is appreciably lower, the UK pages per session is better, and the average session duration is back at a respectable 1 minute. Taking the trouble to focus on the basic, relevant metrics for your business has potentially saved you a lot of un-necessary work and provided a much more accurate perspective on how your website is actually performing. But we can take this one step further. Let’s look at the data in Google Search Console for the same time period.
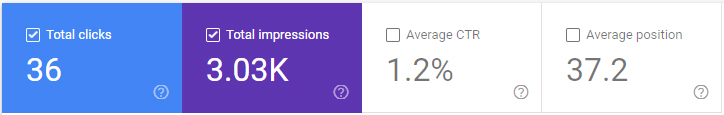
Whoooaa! Only 36 Clicks?! What’s going on?? Well, now we’re seeing your same data from the perspective of Google Search Console. Fundamentally, Search Console and Analytics collect their data and measure that data in very different ways (that’ll be yet another blog I think!). However, one important factor to consider in this view is that Search Console is only looking at the pages that you have submitted for indexing (these should be the pages that you want to show up in search), so any visits to pages that are not indexed for search are likely not to be recorded at all.
Focus On the Metrics That Matter for an Accurate Analysis
In the above examples, we’ve seen how what initially looked like a very comfortable and impressive 853 visits can actually be as low as 36 relevant visits. Other metrics are also badly skewed without proper analysis. Because of the differences in the way Analytics and Search Console collect their data, there is a middle ground here and the actual visits to this site for the time period in question turned out to be around 140 after further close analysis, but that’s still some way off that initially reported figure of 853 of course.
Bonus Tip:
If you are using one of the many digital marketing analytics tracking tools available instead of Google Analytics and Google Search Console, it’s still worthwhile checking that your Google Analytics is correctly filtered. Every one of the marketing analytics tools that I can think of pulls data from your Google Analytics and Google Search Console accounts in order to provide more accurate reports. Obviously, if you have connected them to a non-filtered view of Analytics, then the data they provide will be inaccurate as well.
Using Analytics Tools to Improve Your Website Content
Having obtained an insight into the real numbers interacting with your website, you can also gain an understanding of what people are looking for when they do pay a legitimate visit to your website from Google’s Search Engine Results Pages (SERPs) – the results you see listed on Google after putting in your search term.
If you’ve been closely involved in the creation and content of your website, you will almost certainly have created it with the intention of attracting visits for a specific purpose – let’s say you want to drive repeat visits and engagement that ultimately lead to qualified sales leads. How do you know that visitors are finding your site for the information that you expected them to need? If they come to your site looking for a related topic, that you could use, then that’s valuable information which you can use to improve the content of your site.
Use Google Search Console and select the ‘Performance’ option in the navigation panel on the left-hand side of the page:
From there you’ll be able to look-through all of the queries that have triggered an impression for your site. Use the main navigation to filter on Impressions, Clicks, and select Pages to see which pages are relevant to which Queries.
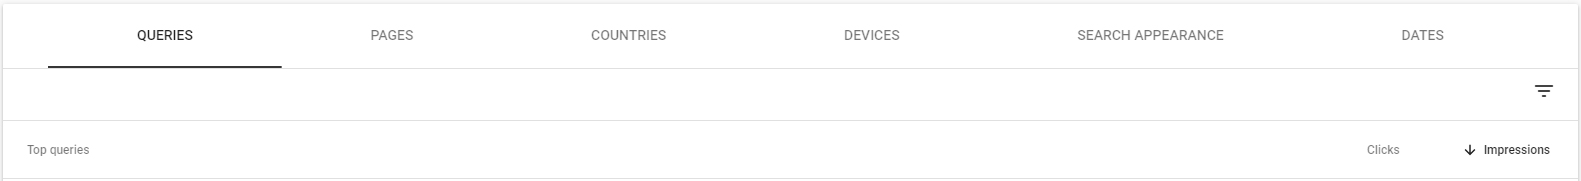
This report can un-earth some surprising opportunities, because it shows which search phrases (keywords) have been relevant to your website’s individual pages. Using it, you can see if your page needs more work to get it to a better position and be in a better position to get a click, or, on the other hand, if it is already receiving clicks, you may well be able to use that keyword in your page text, enhance the content, get more traffic from it and improve your SEO results.
Conclusion
Data analytics are hugely important to all of us in business, and digital marketing analytics used correctly can make a huge difference to the success of your marketing initiatives. Acting on poor data is a recipe for disaster.
The challenge with any kind of data analysis however is of course obtaining accurate metrics that are consistent and relevant. In the article above, we’ve seen how even the most basic information can be wildly misleading if you do not take the time to understand what is being analysed in the background.
If you’d like more insights into the topic, or you’d like Element79 to review your digital marketing analytics, please get in touch with me via our Contact page of this website.


